
NEEP602 Course Notes (Fall 1996)
Resources from Space
Resource Limitations on Earth-Energy
Professor G. L. Kulcinski
Nuclear Engineering and Engineering Physics Department
Lecture 4
January 29, 1996
Space Resources
NEEP 602/ EMA 601/ Geology 376
Introduction
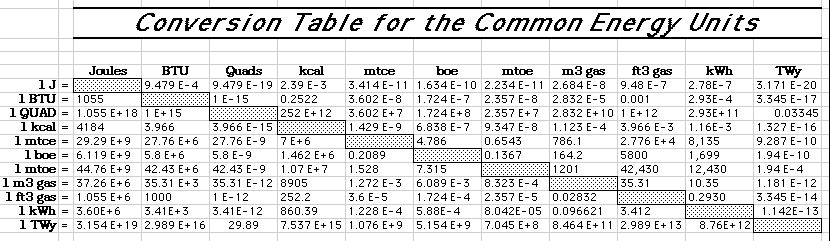
* Definition of common energy units
(Table 1)
 and energy conversion factors
(Table 2).
and energy conversion factors
(Table 2).
* The unit of barrel of oil equivalent (boe) will be used for the rest of this
lecture. Some examples of the magnitude of a boe are given in
Figure 2.
History
United States
* The total energy use in the United States has increased by a factor of
nearly 4 since World War II (Figure 4).
* Although the U. S. energy use per capita has been essentially constant since
the Oil Crisis of 1973, the increase in population will continue to push up the
total energy consumption (Figure 5).
* Fossil fuels still account for over 85% of the primary energy consumed in
the United States (Figure 6).
* Nuclear power continues to be the fastest growing method of producing
electricity in the United States (Figure 7).
World
* The total energy use in the World has increased by a factor of 4 since World
War II (Figure 8).

* The World energy use per capita has been essentially constant since the Oil
Crisis of 1973 (Figure 9).
* Fossil fuels still account for over 85% of the primary energy consumed in
the World (Figure 10).
Present
* The World is conveniently broken up into 6 groups of countries according to
location and economic strength (Figure 11).
 The Organization for Economic
Co-operation and Development (OECD) is the Major "player" in this grouping.
The Organization for Economic
Co-operation and Development (OECD) is the Major "player" in this grouping.
* In 1992, the OECD nations comprised only 18% of the World's population but
consumed 55% of the World's Energy (Figure 12).
* Over the next 15 years, the energy consumption of the non-OECD Asian nations
is projected to increase at 3 times the rate of the OECD nations (Figure 13).
* There is an interesting correlation between electrical energy use/capita and
GNP/capita(Figure 14).
* The share of OECD total primary energy supply used to generate electricity
is increasing (Figure 15).
* Fossil fuels still produce 2/3's of the electricity consumed in the United
States (Figure 16).
Future
* The world population is expected to grow to 10 billion people by the middle
of the 21st century (Figure 17).
* The average world energy use rate is expected to grow from 11 boe/capita in
1995 to 15 boe/capita in 2050 (Figure 18a).
 This is less than 1/3 the current
U.S. usage rate (Figure 18b).
This is less than 1/3 the current
U.S. usage rate (Figure 18b).
* The world annual energy use rates are expected to rise from ~ 60 billion boe
in 1995 to 150 billion boe in the middle of the next century (Figure 19).
* Over 10 trillion boe in energy is needed in the next century (Figure 20).
Reserves
* The world reserves of fossil fuel are dominated by coal (Figure 21).
 There
are ~ 7 trillion boe in the reserve base today.
There
are ~ 7 trillion boe in the reserve base today.
* The present World reserves of U will provide far less than 1 trillion boe if
used in the Light Water Reactor configuration of today's nuclear fission power
plants (Figure 22).
 If the same amount of U were to be used in LMFBR's, the
total energy reserve would be ~ 14 trillion boe.
If the same amount of U were to be used in LMFBR's, the
total energy reserve would be ~ 14 trillion boe.
* When comparing the cumulative energy needs against the economically
recoverable fossil fuels, it is evident that society will have to switch from a
world powered by fossil fuels to perhaps a nuclear powered world in the middle
of the 21st century (Figure 23).

* The use of solar energy has the same potential to provide inexhaustible
long-term energy if energy storage problems, high capital costs, and geographic
heterogeneity problems can be solved (Figure 24).
* The use of Biomass, hydropower, wind, waves & ocean currents, tidal, and
geothermal energy sources will play an important but small role in the latter
part of the 21st century
(Figure 25).

Environmental & Societal Factors
* The emissions from the burning of fossil fuels is approaching 6 billion
tonnes annually, approximately 1 tonne/y per person on the Earth (Figure 26).

* The competition for the last remaining scraps of fossil energy could lead to
armed conflict (Figure 27).

Conclusions
* Sometime in the mid-21st century, the world will need a new, safe, clean, and economical source of energy to satisfy the needs of both developing and developed nations.
* The real question is now how much energy is needed, when, and where it will come from?
* The connection to Space Resources is that the Moon contains enormous amounts of 3He, a valuable and clean fuel for fusion reactors. More later!
Selected References:
L. C. Ruedisili and M. W. Firebaugh, Perspectives on Energy, Oxford University Press, 1978
W. Hafele, Energy in a Finite World, Ballinger Publishing Company, 1981
"Energy for the Planet Earth", September 1990 Issue of Scientific American
"World Energy Outlook", International Energy Agency Publication, Paris, 1993
"International Energy Annual-1993", U. S. DOE Energy Information Administration Report DOE/EIA-0219(93), 1995
"Annual Energy Review-1994", U. S. DOE Energy Information Administration Report DOE/EIA-0384(94), 1995
"International Energy Outlook-1995", U. S. DOE Energy Information Administration Report DOE/EIA-0484(95), 1995
"World Nuclear Outlook-1995", U. S. DOE Energy Information Administration Report DOE/EIA-0436(95), 1995
"Monthly Energy Review, December 1995", U. S. DOE Energy Information Administration Report DOE/EIA-035(95/11), 1995
"Annual Energy Outlook-1995", U. S. DOE Energy Information Administration Report DOE/EIA-0383(95), 1995
Typical Questions That Stem From This Lecture:
1.) What is the expected CO2 emission rate (billion metric tonnes/y) from the burning of fossil fuels in the year 2025 if the current world mixture of fuels stays the same?
2.) How much does the annual net percentage increase in the World population (as assumed in the U. S. Census Bureau predictions) change from 1994-5 to 2049-50? Hint: you may have to use the Web.
3.) What effect would a doubling of the per capita energy use rate in non-OECD Asia have on the total World energy use rate (in Billions of boe) in 1992? How much effect would a 50% reduction in the U. S. per capita use have on the World energy use rate in 1992?
 |
|
University of Wisconsin Fusion Technology Institute · 439 Engineering Research Building · 1500 Engineering Drive · Madison WI 53706-1609 · Telephone: (608) 263-2352 · Fax: (608) 263-4499 · Email: fti@engr.wisc.edu |
Copyright © 2003 The Board of
Regents of the University of Wisconsin System.
For feedback or accessibility issues, contact
web@fti.neep.wisc.edu.
|