NEEP602 Course Notes (Fall 1996)
Resources from Space
Fusion: The Power Source of the 21st Century
Lecture 26
Professor G. L. Kulcinski
March 27, 1996
Need For Fusion
It was clear from the previous discussion (lecture 4) of World future energy needs that some where in the middle of the 21st Century, humanity will need a new, safe, clean, and economical source of energy. It is most likely that such an energy source will be based on nuclear processes, either fission or fusion.
How Fusion Works
The fusion process, much like the fission process, depends on converting mass into energy, or increasing the binding energy per nucleon as depicted in Figure 3 (after Gross, 1984)
As can be seen in Figure 3, the light isotopes of hydrogen and helium are prime candidates for the fusion process.
One of the most important fusion reactions involves the combination of deuterium and tritium to produce a neutron and a "normal" 4He.
Where do we get D and T from?
There are 3 main ways to cause light elements to fuse.
The Sun is a very efficient fusion reactor and a good example of "inertial" confinement.
How ICF Works
It is much harder to cause inertial fusion to take place on the Earth but it has been done many times (in thermonuclear weapons) and more recently under controlled conditions in the laboratory.
There are two main methods of imploding the targets containing fusion fuel: lasers and ion beams (photos courtesy of Lawrence Livermore National Laboratory (LLNL) and Sandia National Laboratory (SNL) respectively)
Once the implosion techniques are successfully mastered, the conversion of the resulting thermonuclear energy into electricity involves standard Rankine cycles and the "unconventional" breeding of tritium. In some cases, Li serves both as a coolant and a breeder material.
The DT filled targets are much more complicated that the spherically symmetric concepts depicted in Figure 9. A few years ago, these schematics could not be shown publicly because of military classification restrictions. The key point of Figure 12 is that in most cases, the lasers or ion beams are used to generate a high flux of x-rays which, in turn, symmetrically implode the targets.
An experimental verification of the interaction of laser beams in a hohlraum is shown in Figure 13 courtesy of LLNL.
One concept for a laser commercial power plant is shown in Figure 14 (courtesy of Los Alamos National Laboratory (LANL)).
Similarly, a picture of light ion beams incident on a target is given in Figure 15 (courtesy of SNL).
and an artist's concept of a heavy ion beam commercial ICF power plant is given in Figure 16 courtesy of Karlsruhe Nuclear Laboratory in Germany and the University of Wisconsin.
How Magnetic Confinement Works
Another approach to fusion involves the heating of a gaseous mixture of fuel atoms to a very high temperature (eventually temperatures of ~100 million degrees Centigrade or more) where they lose their electrons and become ions. Obviously if nothing were done, these hot ions would contact the containment walls and melt them. Fortunately, there is a way to keep the hot ions away from the walls and this relies on the use of strong magnetic fields.
Unfortunately, while the ions can be isolated from the walls, they keep leaking out the ends of the "magnetic bottle". Fortunately, Soviet scientists discovered, in the late 1950's, that if one connects the ends of the "Magnetic Bottles" into a torus, the plasma can be reasonably well confined. This concept is called the Tokamak, and is the leading magnetic confinement concept in the World today. See Figure 18 and Gross (1984).
A feeling for the size of one current experimental Tokamak, the Joint European Torus (JET), can be gained from Figure 18.
While the schematic drawings of a tokamak make them seem relatively simple, the complex magnetic field structures result in interlocking toroidal and poloidal magnets. This complicated geometry can affect maintenance and reliability. See the figures of real experimental facilities in figures 19-21.
 Figure
19 (courtesy of TFTR at Princeton Plasma Physics Laboratory)
 Figure
20 (courtesy of JT-60 at the Japanese NAKA site)
 Figure
21 (courtesy of JET at the European Culham site)
A schematic of a commercial DT magnetic confinement power plant ARIES is
shown in Figure 22,
and a schematic of a Japanese design is shown in Figure 23.
The question should by now cross your mind as to "How hot do I have to make the plasma to cause a sufficient fusion to take place?" One way to understand this area is to measure the reaction rate ( the cross section for the reaction, e.g., in m2, times the velocity of the particles, e. g., m/s). The higher the resulting reaction rate, measured in units of m3/s, the more power that can be produced by that fuel cycle at a given temperature. Figure 24 shows how the DT reaction rate compares to 4 other fuel cycles: D3He, DD, p11B, and 3He3He. It is clear from this figure that the DT cycle requires the least amount of energy to initiate and gives the highest rate of reactions at a given temperature.
An even more relevant comparison can be made by multiplying the reaction rate times the energy released per reaction. See Figure 25.
How Electrostatic Fusion Works
The third method of causing fusion is to accelerate ions at each other through the use of electrostatic fields. This is sometimes called Inertial Electrostatic Fusion, or IEF. The concept was first proposed by Farnsworth, 1966, (who was the inventor of television) and later demonstrated experimentally by Hirsch, 1967. The accelerating voltage can be generated by placing a negatively biased spherical wire grid inside a larger positively biased spherical grid. While such an arrangement can, and has, produced fusion reactions at the 1 Watt or less level, it is not practical for large scale electric power production. The plasma would eventually "burn" up the grid. (However, we shall see later that such a facility can be useful as a commercial source of high energy neutrons or protons.)
The IEF concept was revived by Bussard (1985) who proposed replacing the solid wire grid with a cloud of electrons injected from outside the larger sphere. In this way, the negative potential of the inner "accelerating grid" could be controlled by the energy of electrons injected into the plasma and the electron cloud would be "transparent" to the ions streaming through it.
It is also worth noting that while the inner grid (solid or electron cloud) would be biased to 50-100 kV to maximize the reaction rates, these fields are not strong enough to hold the reaction products from the fusion reactions which are normally released at the 1-10 MeV level. Such particles will stream out through the "grids" and be converted directly to electricity via electrostatic plates far outside the accelerating structures. Efficiencies of converting thermal energy to electricity ranging from ~ 60-80 % are possible.
The reason IEF is more efficient than MCF for high temperature plasmas has to do with the fact that it is the high energy "tail" of the Maxwellian distribution of thermalized plasmas that produces most of the fusion in a Tokamak for example.
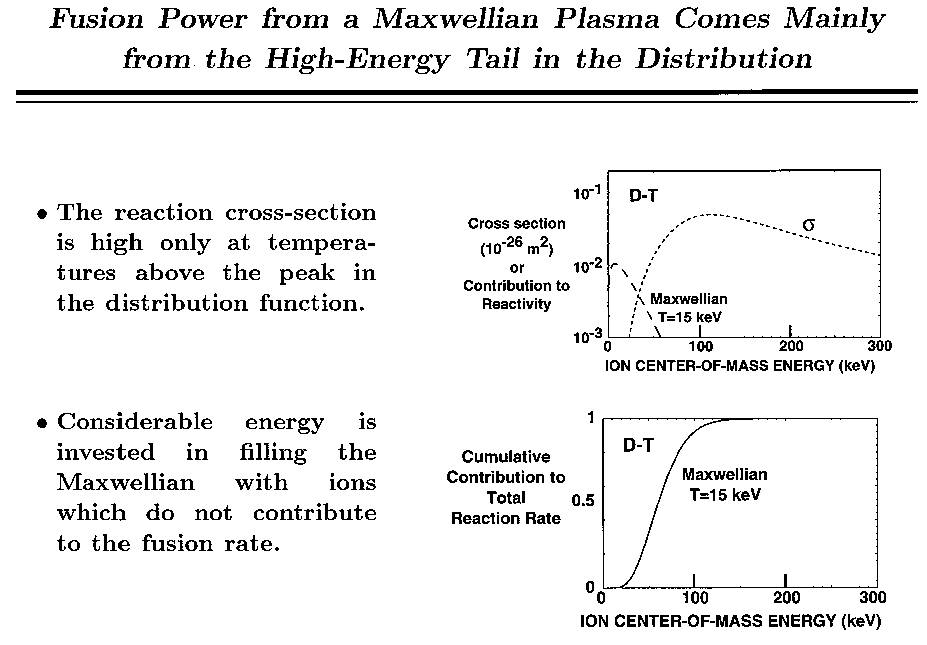 Figure 26b
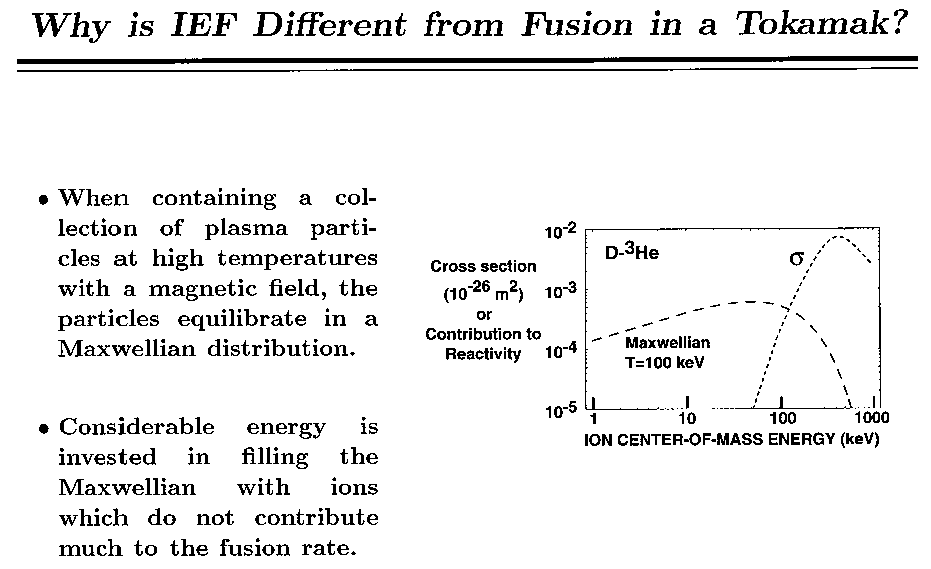 Figure 26c
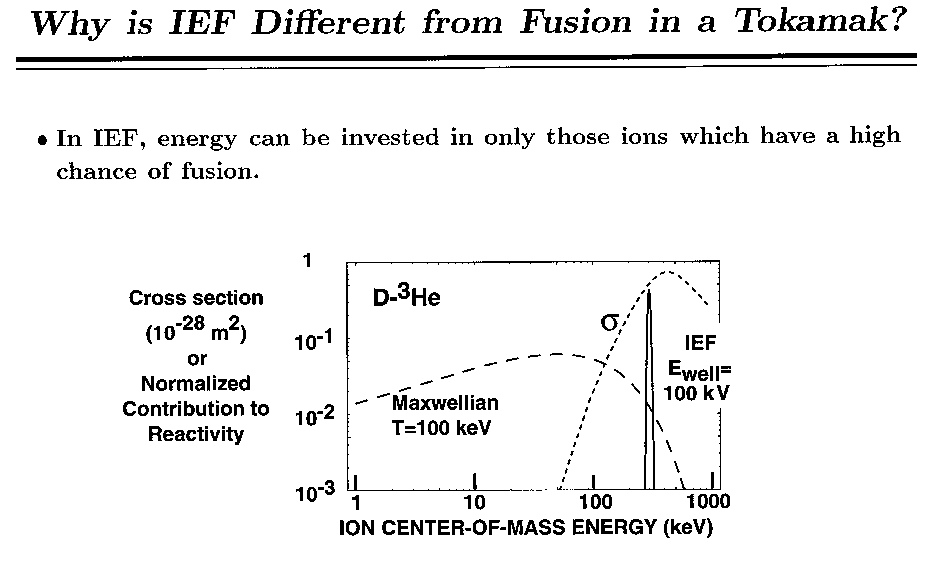 Figure 26d
An experimental example of the IEF concept at the University of Wisconsin is shown in Figure 27 (courtesy of T. Thorson, 1996). This figure shows the reaction of hydrogen ions at the center of the 10 cm diameter inner electrostatic well biased to 18 kV. Recently Mr. Thorson has used deuterium fuels to demonstrate fusion rates of ~107 per second in this small device.
The reaction rates predicted in Figures 24 and 25 do not apply to the IEF concept because the ions are not Maxwellian but rather, limited to a very narrow "temperature" around the accelerating voltage. Therefore the reaction rates must be replotted using the Center-of-Mass energies in terms of the well depth (i. e., the negative bias on the inner grid) This is done in Figure 28 and while the DT is still favored, its advantage is less and lost altogether above ~100 kV.
The key point of this discussion is that the IEF device is more amenable to the use of advanced fusion fuels and the implications of this will be discussed later.
Status
The status of the ICF field is summarized in Figure 29. The ICF community is clearly on the verge of achieving ignition and break-even with U. S. facilities such as NOVA ( Figure 30) or the National Ignition Facility (NIF), Figure 31. See IAEA, 1995, for a review of the status of ICF research.
On the magnetic fusion side, there are 4 major countries working on the
problem with Europe in the lead, Japan second, the U. S. third and the Russians
fourth. See references by Teller, 1981, Stacey, 1984, and Roth, 1986, Cordey
et al., 1992, and Conn et al., 1992 for a review of MCF.
 Figure 32
The amount of fusion power produced in the laboratory has increased by a factor of 10,000,000 in the past 20 years. It is quite possible that the JET device in England will reach the break-even point in 1996-7.
The rate of fusion progress is even greater than that in the computer chip
memory field.
 Figure 34
A new 10 billion facility, called ITER, is currently being designed by the
4 major powers.
 Figure 35
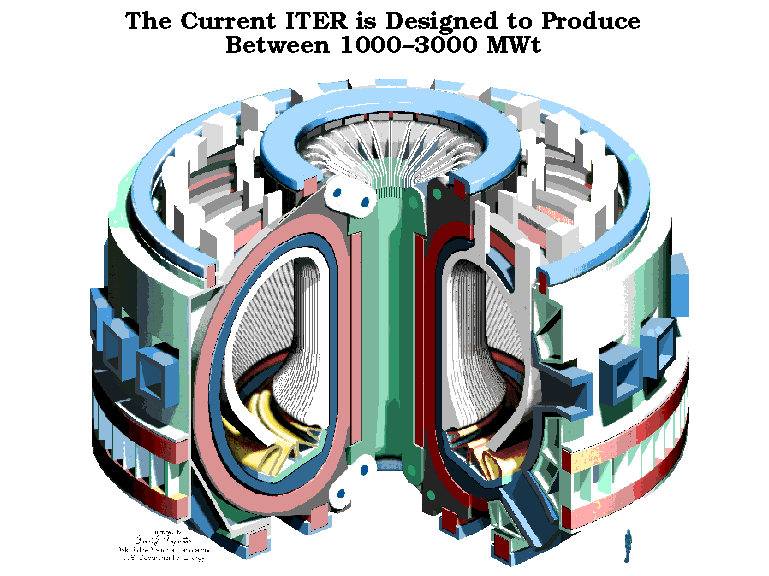 Figure 36
As a side note the University of Wisconsin has been in the magnetic fusion "business" for 30 years and there are many facilities on campus (see Figure 37). Over 200 PhD's have graduated from Wisconsin in the area of fusion research in the past 30 years.
In summary, the "Good News" is:
Unfortunately there is also some "Bad News".
Luckily, there is a solution!
References
Bussard, R. W., 1985, "Methods and Apparatus for Controlling Charged Particles", U. S. Patent 4,826,626, issued May 2, 1989, filed Oct. 29, 1985
Conn, R.W., Chuyanov, V.A., Inoue, N., and Sweetman, D.R., 1992, "The International Thermonuclear Experimental Reactor", Scientific American, April, p. 103
Cordey, J.G., Goldston, R.J., and Parker, R.R., 1992, "Progress Toward a Tokamak Fusion Reactor", Physics Today, January, p. 22
Farnsworth, P. T., 1966, "Electric Discharge Device for Producing Interactions Between Nuclei", U. S. Patent 3,258,402, issued June 28, 1966
Gross, R. A., 1984, Fusion Energy, John Wiley & Sons, New York
Hirsch, R. L., 1967, "Inertial-Electrostatic Confinement of Ionized Fusion Gases", J. Appl. Physics, Vol. 38, p. 4522.
IAEA, 1995, Energy from Inertial Fusion, ed. W. J. Hogan, International Atomic Energy Agency, Vienna
Roth, J. R., 1986, Introduction to Fusion Energy, Ibis Publishing, Charlottesville, VA
Stacey, W. M. Jr., 1984, Fusion-An Introduction to the Technology of Magnetic Confinement Fusion, Wiley & Sons, New York
Teller, E, 1981, Fusion, Academic Press, New York
Thorson, T, Durst, R. D., Fonck, R. J., and Wainwright, L. P., 1996, "Convergence, Electrostatic Potential, and Density Measurements in a Spherically Convergent Ion Focus", Submitted for publication to Physics of Plasmas.
Representative Questions
1.) How much D and T do we burn to make 1000 MWe for 1 year if the energy released per fusion is 17.6 MeV and the conversion efficiency is 35%?
2.) What is the electrical energy content of the deuterium in Lake Mendota if the DD reaction releases on the average 3.6 MeV and the conversion efficiency is 35%?
3.) How many neutrons are produced in a DT fusion power plant that generates 1,000 MWe for 80% of the year for 40 years. How does that compare to the number of neutrons produced in a fission reactor that produces the same total energy? Assume thermal conversion efficiency of 35% in both systems.
 |
|
University of Wisconsin Fusion Technology Institute · 439 Engineering Research Building · 1500 Engineering Drive · Madison WI 53706-1609 · Telephone: (608) 263-2352 · Fax: (608) 263-4499 · Email: fti@engr.wisc.edu |
Copyright © 2003 The Board of
Regents of the University of Wisconsin System.
For feedback or accessibility issues, contact
web@fti.neep.wisc.edu.
|
 Figure 1
 Figure 2
 Figure 3
 Figure 4
 Figure 5
 Figure 6
 Figure 7
 Figure 8
 Figure 9
 Figure 10
 Figure 11
 Figure 12
 Figure 13
 Figure 14
 Figure 15
 Figure 16
 Figure 17
 Figure 18
 Figure 22
 Figure 23
 Figure 24
 Figure 25
 Figure 26
 Figure 27
 Figure 28
 Figure 29
 Figure 30
 Figure 31
 Figure 33
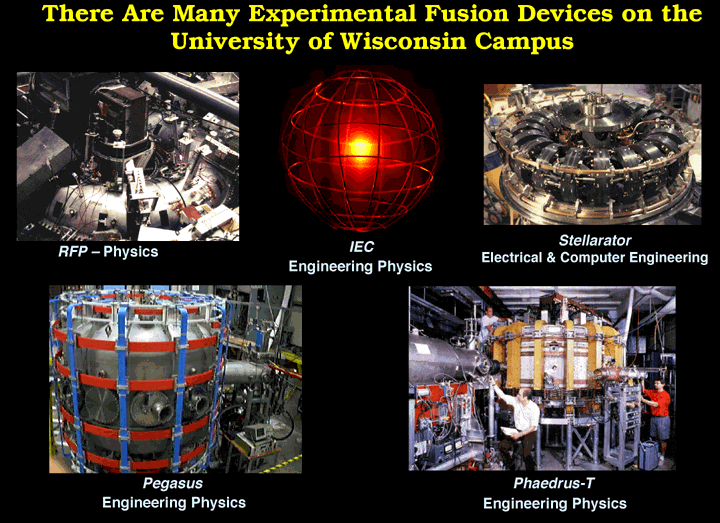 Figure 37
 Figure 38
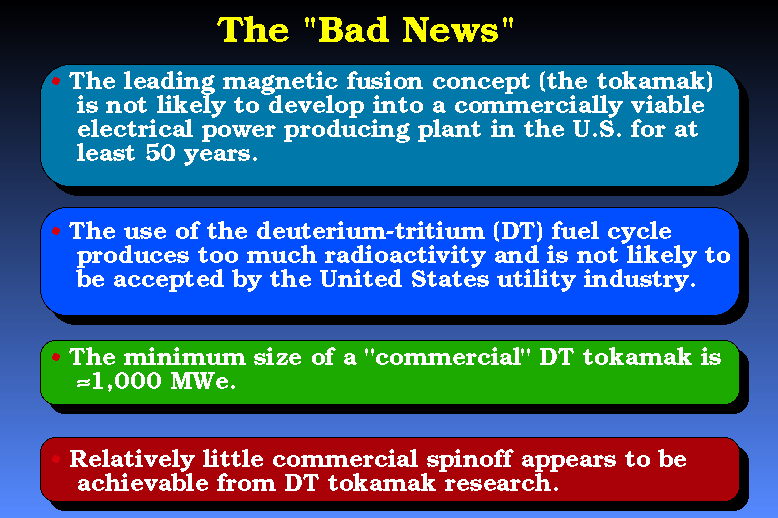 Figure 39
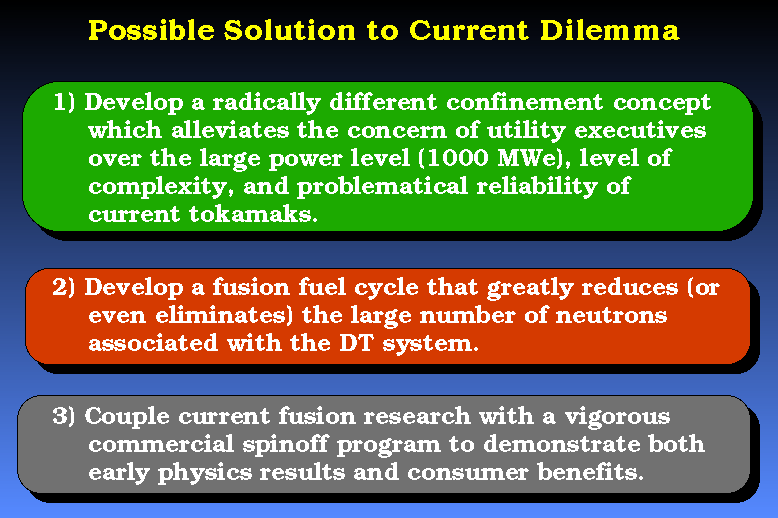 Figure 40