NEEP602 Course Notes (Fall 1996)
Resources from Space
Excerpt from:
Helium Resources of Mare Tranquillitatis Elements
WCSAR-TR-AR3-9207-1
E.N. Cameron (1992)
The Mare Regolith
General Description
Lunar regoliths have been the subject of numerous studies, beginning with the pioneering work by Shoemaker and others (1967). The name is applied to the loose, predominantly fine-grained material that blankets the lunar surface. The regolith has two major components, (1) particles of minerals and rocks and (2) agglutinates. Agglutinates are mineral and rock particles welded together by glass produced by partial melting of rock and mineral material due to impacts. In the early stage of formation, a regolith consists of a high proportion of mineral and rock fragments. As gardening of the regolith by impact continues, the proportion of agglutinates rises, finally reaching a stage at which the number of particles produced by comminution is balanced by the number of agglutinate particles formed. At this point the regolith is said to be mature. In general, the regolith of an ancient mare like Tranquillitatis will be mature. However, there will be variations in maturity where recent impacts have brought new materials to the surface.
Mare regoliths are derived mainly from the immediately underlying basaltic volcanics, but they are contaminated, perhaps everywhere, by highland material ejected from large post-mare craters in adjacent highlands and also from intra-mare craters that penetrate to the floor of the mare. Thus Papike and others (1982) point out that whereas mare basalts from Apollo 11 and Apollo 17 contain 10.5 to 13.5% TiO2, the overlying regoliths contain only 7.5 to 8.5% TiO2. They attribute the difference to contamination with highland material, clearly indicated by the appearance of highland material in the modal analyses discussed below.
Modal Composition
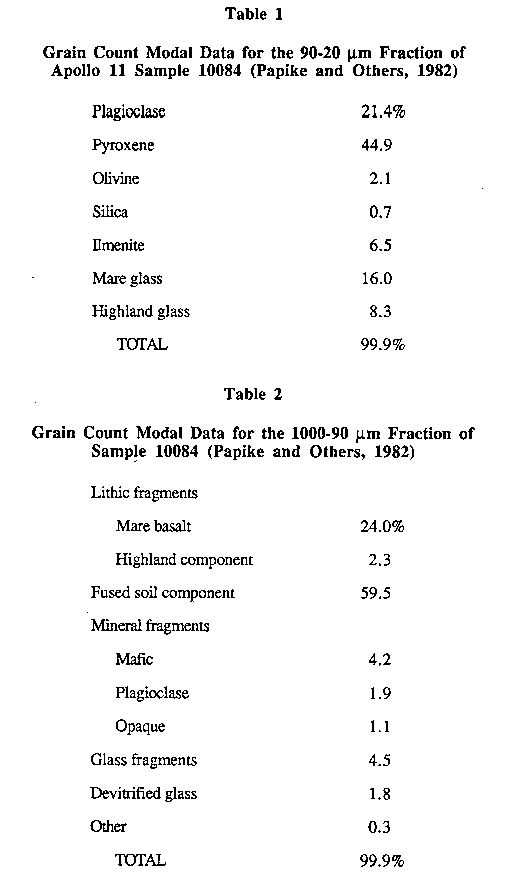
The modal composition of the regolith at the Apollo 11 site has not been completely determined, but the composition of the 90-20 um fraction is given in Table 1, and the composition of the 1,000-90 um fraction is given in Table 2. Lithic fragments and fused components are not included in Table 1.
Grain (Particle) Size
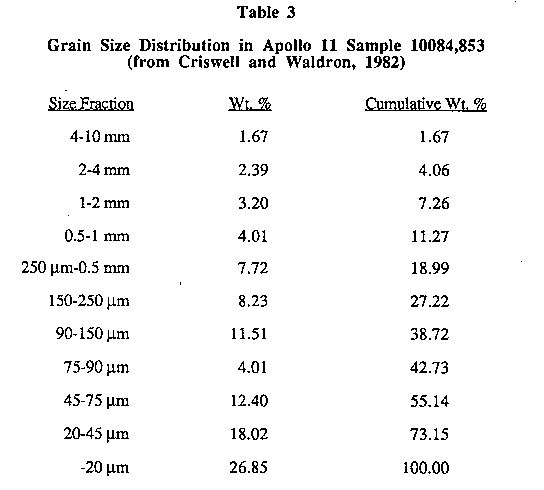
Samples of the regolith brought back by Apollo 11 consist predominantly of particles less than 1 mm in diameter (Table 3). It should be noted, however, that no large bulk samples were obtained, and there is no information on the abundance of large blocks; such blocks would certainly not be included in the samples.
The only appraisal of particle size distribution in total regolith that I have been able to find is that of Shoemaker and Morris (1968). Those investigators made a detailed study of particle size distribution in regolith as displayed in high-resolution photographs taken at the Surveyor I, III, V, VI, and VII sites. Resolution of the photographs is 1 mm, hence only particles 1 mm and larger could be counted. Size-frequency curves were plotted for these particles and extrapolated to sizes smaller than 1 mm (Fig. 10). The curves indicate the predominance of particles less than 1 mm in diameter in the regolith. Surveyor I landed inside Crater Flamsteed, but Surveyor III, Surveyor V, and Surveyor VI landed on typical maria, respectively Oceanus Procellarum, Mare Tranquillitatis, and Sinus Medii. Larger particles include both solid rock fragments derived from bedrock and agglutinates of varying cohesion. It seems likely (H. Schmitt, personal communication) that many of the latter will be disintegrated during excavation and handling on a mining machine.
Structure of the Regolith
The structure of the regolith, in the few core samples brought back by the Apollo missions, has been studied in detail. A crude, mostly indistinct layering is generally present. It is inferred from this that the regolith consists predominantly of successive and interleaved ejecta blankets spread out around the craters. A typical blanket must originally have consisted of a more or less circular sheet thinning away from its inner edge at the crater rim. Given the range of impact magnitudes, widths of ejecta halos must range from millimeters to kilometers, and thicknesses of halos at their inner edges must range up to tens of meters or more. Once formed, an ejecta halo becomes subject to modification, interruption, or even partial or complete obliteration by later impacts. As a result, it must be expected that the internal structure of the regolith will be extremely complex. The implications of this for exploration of the regolith will be discussed in a later report.
Thickness of the Regolith
The thickness of the regolith on Tranquillitatis is a matter of prime importance for the mining of helium and is a controlling factor for all estimates of tonnage of regolith available. The thickness will certainly vary from place to place. Thickness should be nil or nearly nil on the rims and floors of very young craters. Thickness should be greatest just outside the rims, then decrease progressively with distance from the rims. The same rules, however, should not apply to very old craters, which have undergone long periods of degradation due to gravitational slumping and continued bombardment. There may be very little variation in thickness of regolith across them.
There are no direct measurements of regolith thickness on the surface of Tranquillitatis. Estimates of thickness are based on studies of craters and ejecta as displayed on lunar photographs, mathematical modeling of the mechanics of crater formation (Melosh, 1975), and passive seismic experiments. Shoemaker and others (1967) noted at the Surveyor V landing site that two craters respectively 15 m and 20 m in diameter were surrounded by strewn fields of blocks. Assuming crater depth to diameter ratios of between 1/3 and 1/5, they concluded that the depth of regolith is not greater than 5 meters. Shoemaker and others (1970) estimated regolith thickness at the Apollo 11 landing site at 3 to 6 m. This estimate is based on the observed depths of anomalous flat-floored craters and craters with central mounds, assuming that the floors are at the top of the bedrock surface. Nakamura and others (1975), from the passive seismic experiment, calculated the depth of regolith at the Apollo 11 site as 4.4 m.
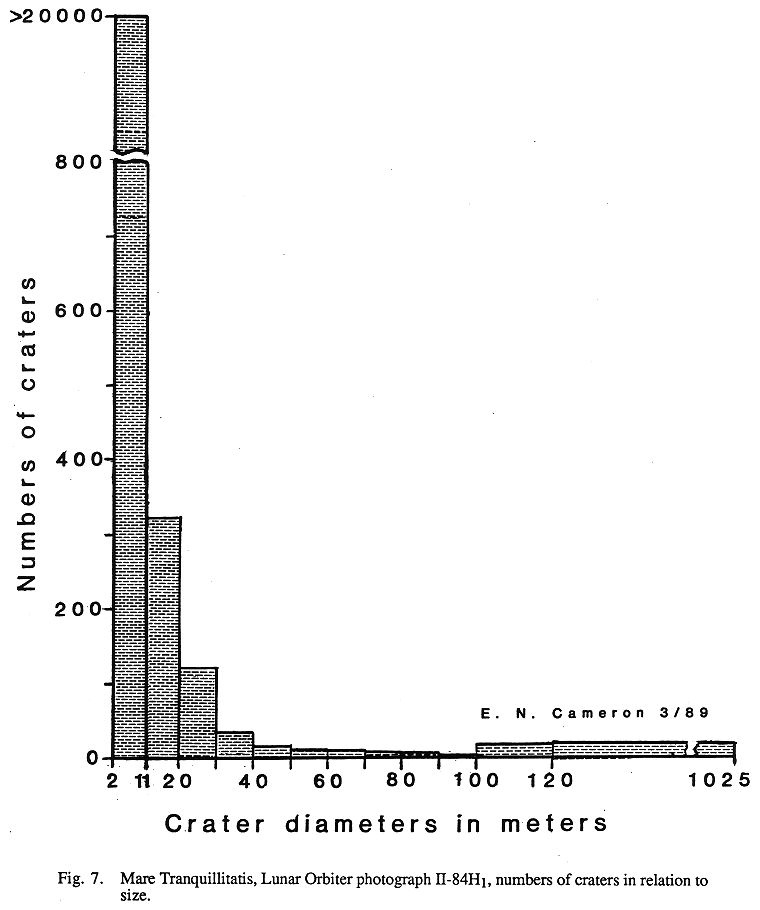
The writer believes that information on the thickness of the regolith over broad areas is best obtained at present from studies of very small craters on high-resolution photographs of the mare. A special study of such craters on high-resolution photographs of the area east of the Apollo 11 landing site has therefore been made. Findings of the study are the following:
1. All craters less than 12 m in diameter (the smallest visible are 2 m in diameter) are fresh craters with sharp rims. Presumably they are of Copernican age.
2. Many such craters are superimposed on older larger craters with less distinct rims.
3. The density of fresh craters, as indicated by counts of sample areas, is in the neighborhood of 1,000 per sq. km.
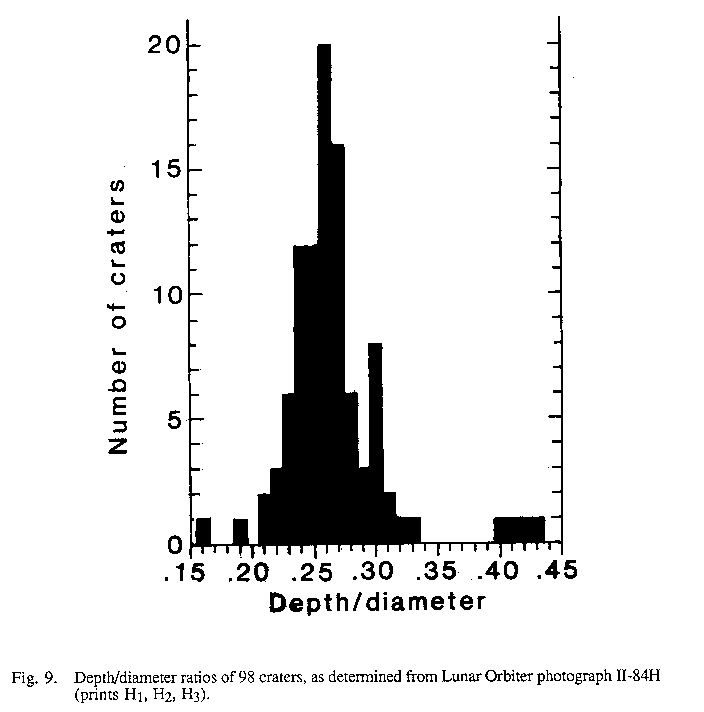
4. Depth-diameter ratios of most small fresh craters are very close to 0.25 (Fig. 9). This holds for small craters away from larger craters as well as for those superimposed on older craters.
5. Fresh craters less than 18 m in diameter have smooth walls and floors. No blocks or other irregularities are visible within them. Bedrock was evidently not penetrated by the craters.
From these observations the following conclusions can be drawn:
1. By the time the young, fresh craters began to be formed, older craters less than about 4.5 m deep (less than 18 m in diameter) had been obliterated by impacts.
2. By early Copernican time the regolith was already more than 3 m deep.
3. An estimate of 3 m for the average depth of regolith away from larger craters is therefore conservative, especially in view of the presence of regolith more than 3 m deep on the rims of older craters.
In a subsequent section, an average depth of regolith of 3 m and a ratio of depth to diameter of 0.25 is used as the basis for delineating block-strewn areas around craters; i.e., areas of regolith containing blocks of bedrock.
Helium Content of the Regolith
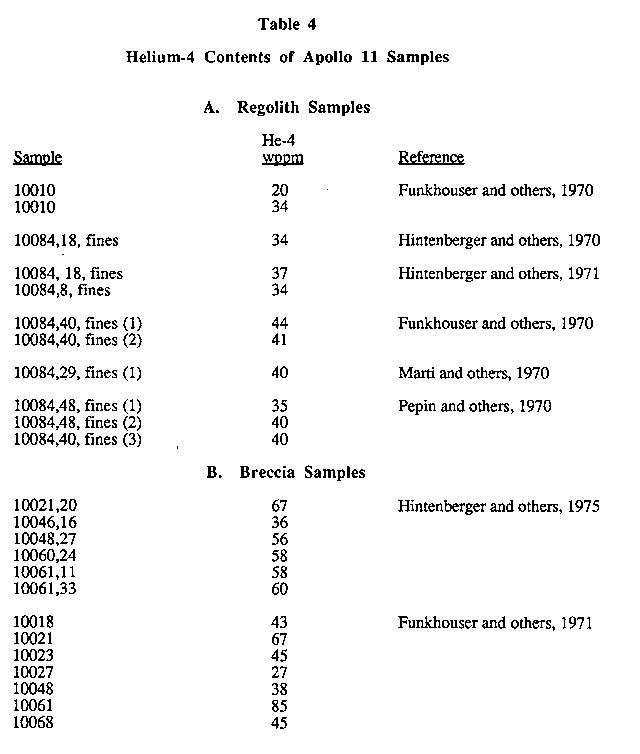
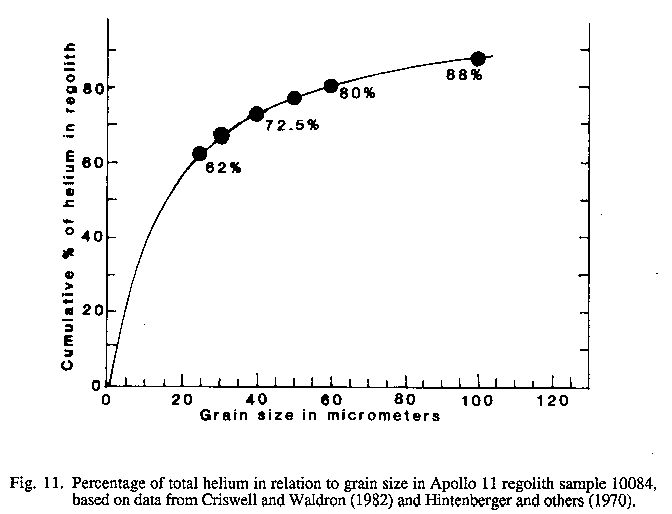
Information on the helium content of the regolith of Mare Tranquillitatis is from two sources: (1) analyses of samples taken from the Apollo 11 landing site and (2) inferences based on the relationship between the He contents and the TiO2 contents of lunar regoliths in general. Helium contents of various Apollo 11 samples are given in Table 4. The data are for bulk samples and for "breccias", particles produced by impact-welding of regolith particles. Note that the average He content of breccias is higher than the average He content of the fines, despite the fact that analyses of size fractions invariably show that He is enriched in the finest fractions (Fig. 11), whereas the breccia particles are much coarser. No explanation of this anomaly is at hand.
There are four problems in using analyses of Apollo 11 regolith samples for evaluation of helium resources. The first problem is whether the regolith at the Apollo 11 landing site is representative of the regolith of the surrounding mare. According to Wilhelms (1987, p. 235), the lunar module Eagle was about 400 m west of the 180- m- wide, 30- m- deep crater "West" between blocky rays of the crater, and Beaty and Albee (1978, 1980) suggested that almost all the samples were derived from the ejecta of the crater. Exposure ages of samples indicate the crater is about 108 years old. At the landing site, bedrock-derived finer ejecta between the blocky rays may thus have covered, or at least contaminated, the normal regolith of the mare, which may be higher in He content due to greater age and longer exposure to the solar wind.
The second problem is possible loss of helium from regolith during excavation and handling of the materials before analysis. Hintenberger and others (1970) analyzed two sets of grain-size fractions of Apollo 11 regolith sample 10084. Mass balance calculations show that for one set total helium content of the fractions is 22% less than the content reported for the bulk sample. For the second set the deficiency is 31%. Analytical error is given as only 3%, and nothing in the article suggests a source of such large discrepancies. Similar deficiencies for samples from Apollo 16 and Apollo 17 have been noted by Swindle and others (1990). The size fractions were obtained by sieving, and one must suppose that He was lost during the mechanical handling involved. This leads one to question whether there was further loss during excavation of the samples and handling prior to the arrival of the samples at the analytical laboratory. If so, the He contents reported for regolith samples may be a better index of how much He will actually be present at the heating stage of the extraction process, after excavation and processing of the regolith, than of the He content of regolith in the ground. Further investigation is clearly needed to resolve this problem.
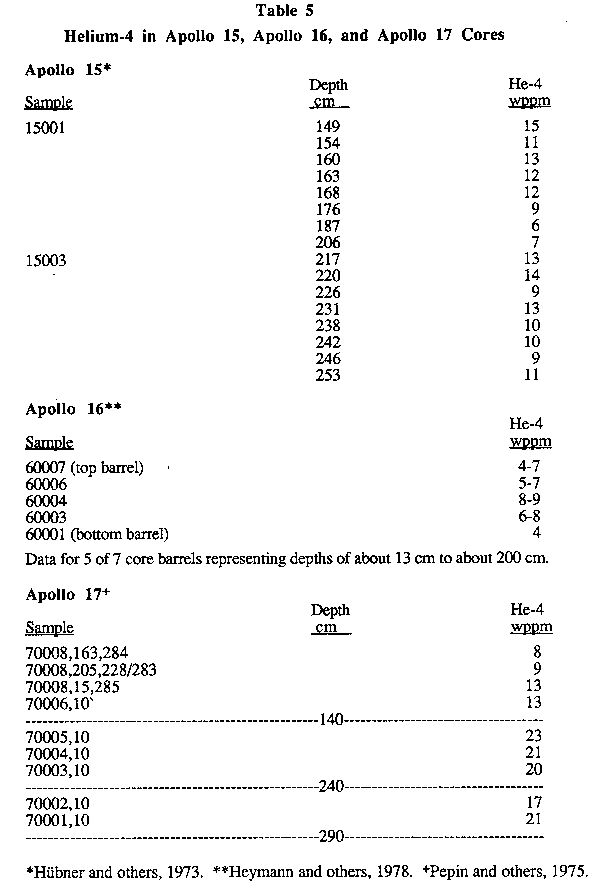
The third problem is that all samples of regolith returned from the Apollo 11 site are surface samples, hence there is no direct information on variation in the He content of the regolith of Mare Tranquillitatis with depth. However, samples from drill holes at the Apollo 15, Apollo 16, and Apollo 17 sites are relevant here, since they suggest what variations in He content with depth may be expected in lunar regoliths. Results of analyses of cores from drill holes at the three sites are given in Table 5. The Apollo 15 and Apollo 16 cores show variation in He content but no correlation of content with depth. The average He content of the Apollo 15 samples is 10.8 wppm. The average for 11 Apollo 15 surface samples is 11.1 wppm. The average for Apollo 16 core samples is 6.4 wppm. The average for 22 surface samples (Hintenberger and Weber, 1973; Haskin and others, 1973; Walton and others, 1973) is 6.7 wppm. The Apollo 17 drill core shows an increase in He content with depth. Apollo 17 samples are too heterogeneous to permit calculation of a meaningful average He content. At any rate, core and surface samples give no indication of a systematic decline, or increase, in the He content of regolith with depth. This is hardly surprising. Given the repeated overturn of regolith due to impact gardening during the more than 3 billion years since Mare Tranquillitatis was formed, no systematic pattern of variation with depth is likely to be found. Instead, an irregular pattern of small-scale variation, both vertically and laterally, is to be expected. For any given site, the range of helium content in depth could well be the same as that shown by surface samples.
The fourth problem is that samples from the Apollo 11 landing site provide the only direct evidence of the He content of the regolith of Mare Tranquillitatis. The He content of the regolith of the mare as a whole must be inferred from data for lunar regoliths in general. For mare regoliths, the following findings (Cameron, 1988, 1990) are critical to the delineation of areas of regolith that are enriched in He:
(1) Regoliths of some maria or parts of maria contain less than 20 wppm He, but regoliths of certain other maria have He contents ranging from 25 to nearly 50 wppm.
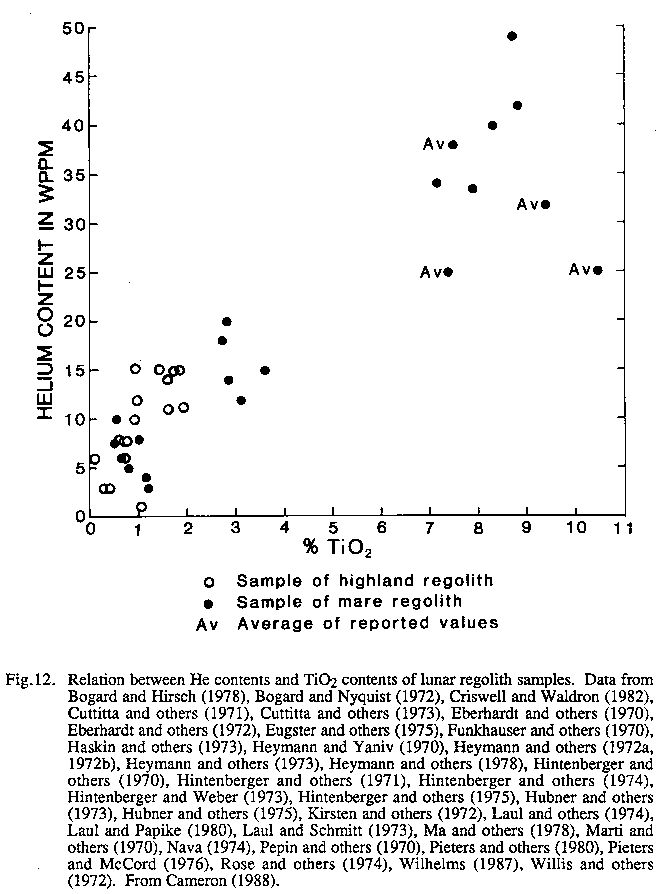
(2) The helium content of a regolith sample is primarily a function of its composition and its exposure time; i.e., the time over which it has been exposed to the solar wind. As to composition, the TiO2 content is particularly important (Cameron, 1988). Analyses of lunar samples show that in general regolith samples enriched in TiO2 are likewise enriched in He (Fig. 12). The relationship is not perfect, and the scatter in the diagram is undoubtedly due in considerable part to difference in the exposure times of the various samples. At present the most useful index of exposure time is the maturity index, defined as I/TiO2, where I is the intensity of the ferromagnetic resonance of the sample. Jordan (1989) has shown that a more linear relationship is obtained if the He content is plotted against (I/FeO) TiO2. However, means of measuring the maturity index by remote sensing are still not worked out, hence the He/TiO2 relationship is still the best available index of the He content of regolith. It is so used in this report.
General Statement
(1) What percentage of the total area of the mare is covered by high-TiO2 regolith, and what variations in He content within high-TiO2 areas are to be expected?
(2) How much of the total area of the mare, roughly 300,000 sq. km, is physically amenable to mining for He-3?
(3) What is the distribution and what are the sizes of the minable areas?
Pending further investigation of the mare, no final answers to these questions can be given. The following sections, however, summarize available relevant information and provide preliminary answers.
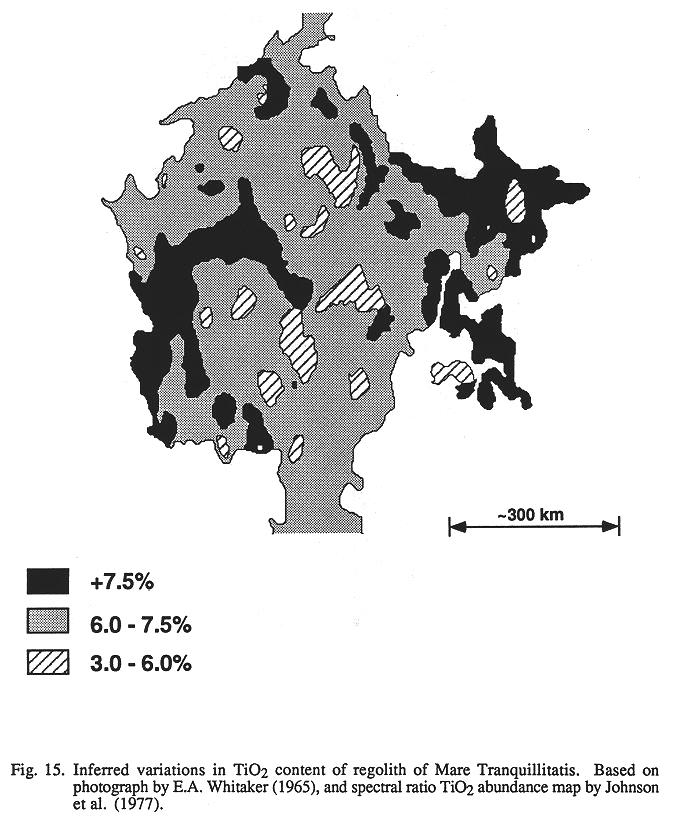
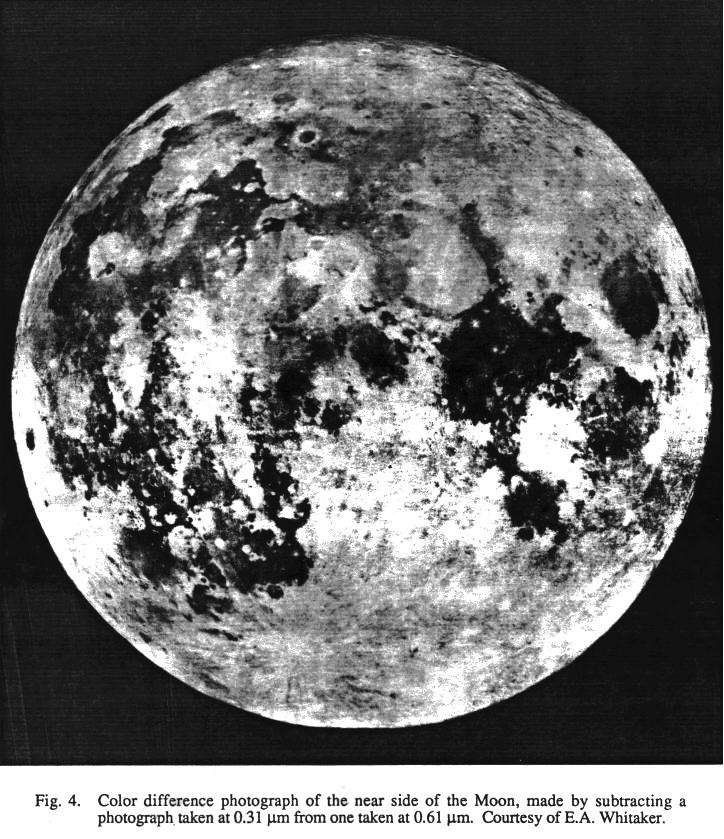
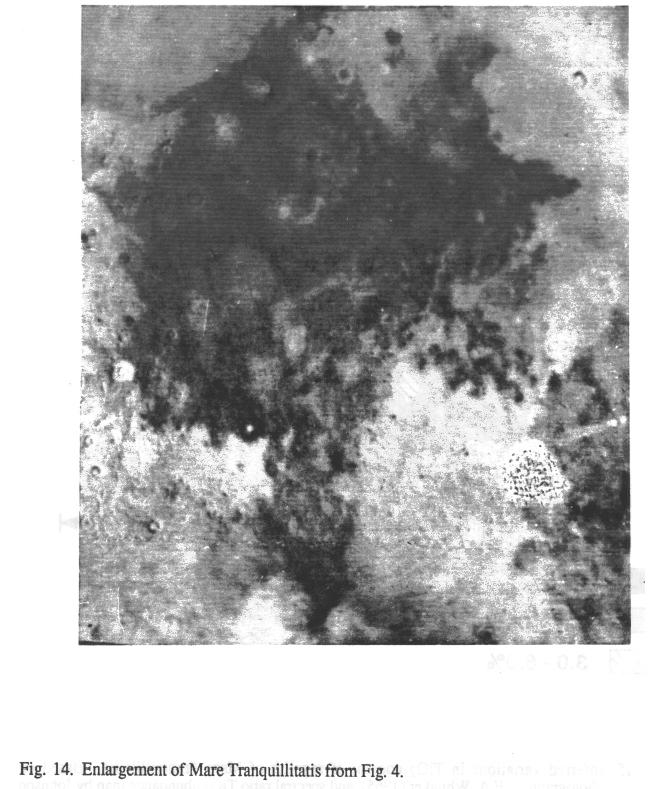
On an overlay of an enlargement of the portion of Whitaker's photograph that covers Mare Tranquillitatis (Fig. 14) the areas occupied respectively by black regolith, dark to medium gray regolith, and light gray regolith were outlined. The result is Fig. 15. Calculations from measurements made on Fig. 15 indicate that 28% of the mare is covered by black regolith in part mottled with dark gray, 65% by dark gray to medium gray regolith, and 7% by light gray to white regolith. The inferred TiO2 contents of the three classes are respectively 7.5%, 6 to 7.5%, and 3 to 6%. The black regolith should then contain 30 to perhaps 45 wppm of He, the dark to medium regolith presumably will contain 20 to 30 wppm He.
The estimates of helium content apply to mature regolith. As discussed earlier, maturity is a function of length of exposure to the solar wind. Given the nature of the process of gardening of the regolith by impacts, exposure time may vary both laterally and vertically in the mare. Such variations cannot be detected by any of the available methods of remote sensing. However, Apollo 11 regolith samples are mature, and given the great age of Mare Tranquillitatis and the evidence that successive generations of craters have been created and then destroyed or largely destroyed by impacts, it seems reasonable to infer that much of the mare is underlain by mature regolith. Besides maturity, degree of dilution with highland material will also affect the helium content. Only systematic sampling can determine actual patterns and degree of variation.
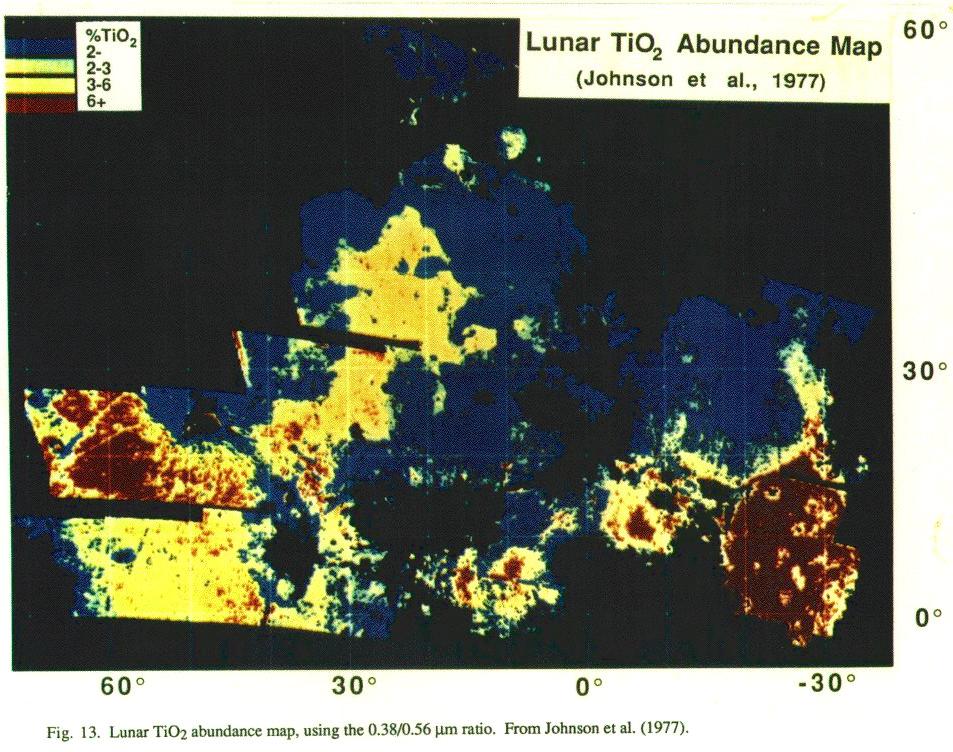
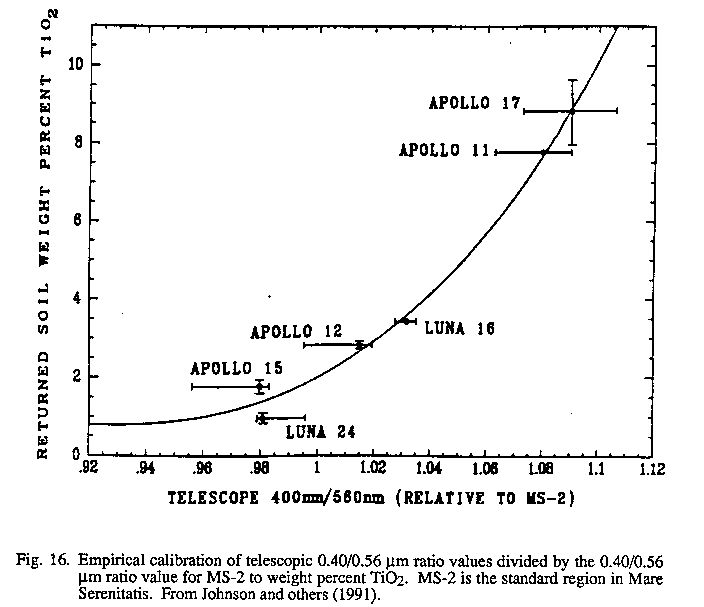
Since my report of 1990 was written, J.R. Johnson and others (1991) have published a TiO2 abundance map of the lunar nearside constructed from 0.40/0.56 um ratio values converted to weight percent TiO2 using the calibration curve of Fig. 16, in which TiO2 is plotted against measured 0.40/0.56 um values divided by 0.40/0.56 um ratio values for the MS-2 region of Mare Serenitatis. The ratio images for mare areas are classified into 9 units, <3%, plus 8 units from 3 to 10+%. On their abundance map high-TiO2 regolith (6% or more TiO2) in Mare Tranquillitatis is largely confined to the western half of the mare. The TiO2 content of the regolith of most of the eastern half of the mare is shown as 4 to 5%, but there are small patches with <3% TiO2 and other small patches with 6% TiO2.
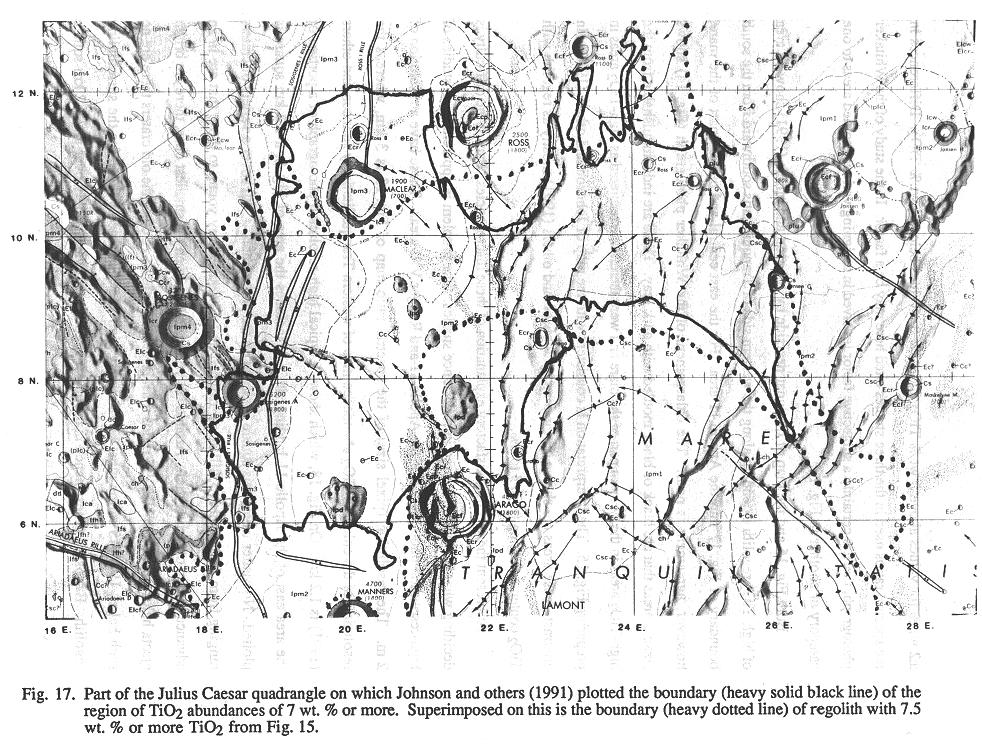
Besides the TiO2 abundance map of the entire lunar nearside, Johnson and others produced two enlarged abundance maps of west central Mare Tranquillitatis with a resolution (pixel size) of 1.2 km. On the western half of one of the maps (their Figure 7, upper map) a large area with 6% to more than 10% TiO2 is shown.[*] This map was used as the base for a sketch map outlining the region of TiO2 abundance of 7% or more on a part of the geologic map of the Julius Caesar quadrangle. I have enlarged this map to the scale of the original geologic map and have plotted on
it the boundary of category A regolith (+7.5% TiO2) from an enlargement of Fig. 15 to the same scale. The result is Fig. 17.
Considering the sources of error in reflectance maps and in interpreting the color difference photograph of Whitaker (Fig. 4), agreement of the two high-Ti boundaries is reasonably good. Sources of error in measuring and interpreting spectral ratios are discussed in detail by Johnson and others, the most serious being errors in measurement of spectral ratios (+/-2 wt.% for values above 3% TiO2) and inadequate calibration of the curve of Fig. 16 in the range above 3% TiO2. The accuracy of the earlier spectral ratio map by Johnson and others (1977) is estimated by them at +/-2 wt.% for values above 5 wt.% TiO2 and <1% for values below 4 wt.% TiO2. Differences in the spectral ratios used in the three studies cited here may be a factor. In the study of the Whitaker photograph, there is certainly a subjective factor involved in assigning various mottled areas to one category or another in Fig. 15.
Both Fig. 15 and the map of the lunar nearside by Johnson and others (1991) show an area of high-TiO2 regolith extending along the western side of Tranquillitatis southward from the south boundary of Fig. 17 into the Apollo 11 area. For the east central and eastern part of the mare, however, agreement is poor. The enlargement of the Whitaker photograph (Fig. 14) shows sizable areas that are black or black mottled with dark gray. These are indistinguishable from the high-TiO2 areas in the western part of the mare and were therefore interpreted as high-TiO2 areas in preparing Fig. 15. The interpretation is consistent with the map of Johnson and others (1977). In contrast, these areas are shown on the map by Johnson and others (1991) mostly as regolith with TiO2 contents ranging from 3 to 6%.
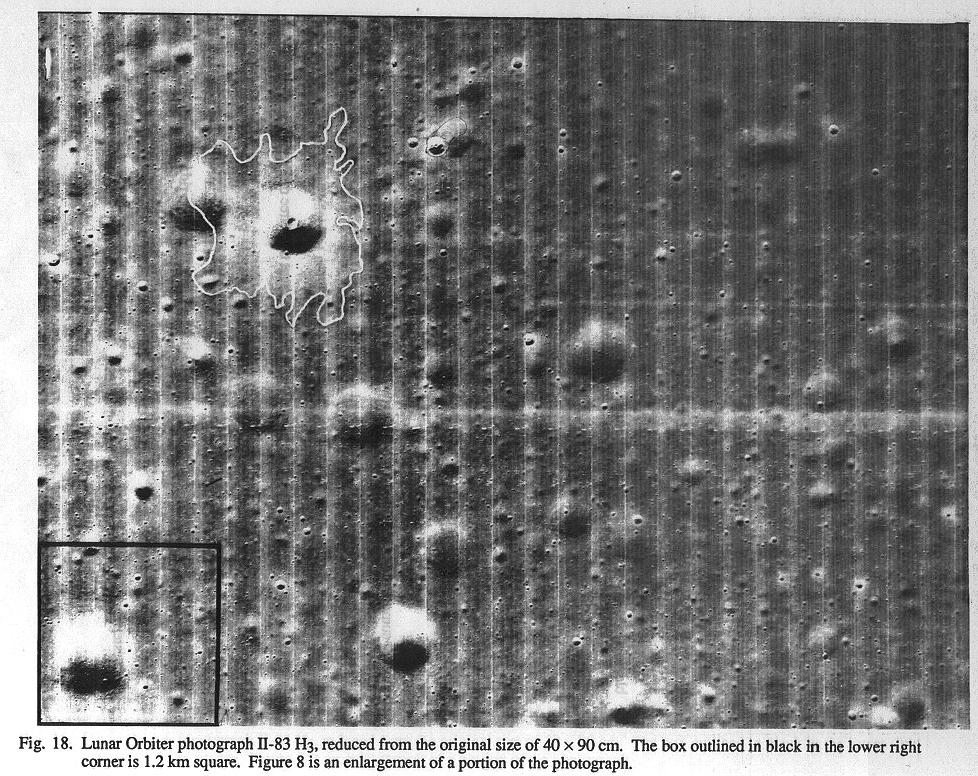
At present there is no satisfactory explanation of these discrepancies. Part of the difficulty is deciding what is being measured in reflectance studies. The problem is apparent from studies of high-resolution photographs of the Apollo 11 and Ranger VIII areas. These have a resolution of 2 m. The resolution (pixel size) of the spectral ratio map of Fig. 13 is 3 km, whereas the resolution of the enlarged TiO2 abundance map of western Tranquillitatis by Johnson and others (1991) is 1.2 km. On Fig. 18, which shows a typical high-resolution photograph of a portion of the area east of the Apollo 11 landing site and includes the area of Fig. 8, a 1.2 km square is plotted. No matter where this square is placed on the photograph, it will cover a variety of craters ranging from those that are still sharp-rimmed and obviously very young to those that are in an advanced stage of obliteration. Around the young craters, even the smallest ones, there are bright ejecta halos, for which UV/VIS ratios must be relatively low. Around the old craters there are no such halos; UV/VIS ratios must be relatively high and the same as those for the surrounding regolith. Exposure times (hence maturity) of regolith will vary widely over any 1.2 km square area. Measurement of such an area will inevitably give an average value of a range of reflectance ratios that are not determined solely by variations in the TiO2 content of regolith. This has now been recognized by the investigators at Arizona on the basis of reflectance measurements with improved resolution (Melendrez, 1992).
Another matter that must be considered in interpreting reflectance ratios is the nature of mining operations involved in recovering He and other gases from the regolith. The ejecta halos around younger craters that have penetrated bedrock will contain blocks of rock that must be separated from the regolith before it can be treated. Around the large crater of Fig. 8, as previously noted, blocks of rock down to the limit of resolution (2 m) can be seen, and smaller blocks must be present outside the white line. For any given mining machine, there will be an upper limit of the size of the blocks that can be handled. For example, the mining machine designed by Sviatoslavsky and Jacobs (1988) will handle only blocks less than 40 cm in diameter. For reasons of physical minability, therefore, mining will inevitably focus on areas that have low percentages of younger craters of sufficient size and depth to penetrate bedrock. In general, the TiO2 value assigned to a pixel will therefore be lower than the TiO2 value of the regolith actually mined.
In summary, remote sensing of the lunar surface involving the use of spectral ratios has been extremely successful in outlining maria and parts of maria that, at surface, have TiO2 contents ranging from 4 to more than 10%. This is a major contribution to identification of areas most favorable to the recovery of He. For Tranquillitatis it is important that three different investigations have identified the western part of the mare as a major source of high-Ti regolith. However, the northeastern area of the mare shown on the map of Johnson and others (1991) as lower in TiO2 contents should be investigated further, because it is less disturbed by ridges, major craters, domes, and rilles and therefore could have a higher percentage of physically minable regolith than the western area.
Back to Syllabus (Fall'96)
 |
|
University of Wisconsin Fusion Technology Institute · 439 Engineering Research Building · 1500 Engineering Drive · Madison WI 53706-1609 · Telephone: (608) 263-2352 · Fax: (608) 263-4499 · Email: fti@engr.wisc.edu |
Copyright © 2003 The Board of
Regents of the University of Wisconsin System.
For feedback or accessibility issues, contact
web@fti.neep.wisc.edu.
|