NEEP602 Course Notes (Fall 1997)
Resources from Space
Overall Effect of Space Resources on the Earth-Moon System
When we examine the "net" effect of resources from space, we need to consider both the positive effects on the earth and the negative effects on the moon. The major impacts to consider from both sides are listed in Figure 1. The positive effects on the earth's environment have been discussed in Lecture 27 and we will concentrate on the lunar impacts here.
 Figure 1
Before we discuss the environmental effects on the Moon, we must ask ourselves "What are the lunar resources that we expect to use on the Earth? On the Moon? In Space?"
 Figure 2 Figure 2 |
 Figure 3 Figure 3 |
The possible effects of lunar mining on the "atmosphere" are discussed in Figure 4.
 Figure 4
Disruption of the lunar surface will change the albedo of the local area but will not have a visible effect from the Earth.
 Figure 5
Finally, we must recognize that wastes on the Moon will not contaminate the lunar environment in the ways we are used to on Earth because there is no air or water.
 Figure 6
Energy Issues
Let us now concentrate our attention on the energy supply only. A simple consideration of the type of energy we may import to Earth from Space reveals that only 3He and solar energy (collected with solar cells, converted to microwaves, and beamed to the Earth) appear feasible now.
 Figure 7
The next question to ask is "How much energy will be needed on the Earth in the Future?"
 Figure 8
(In this case we should expand our vision as far as possible, e. g., to the year 2100) While nobody knows the answer to that question, we can use the same approach we used in Lecture 3 to get a reasonable (and conservative) estimate. The total energy needs are a simple product of the World population and the energy used per capita.
 Figure 9
The projection of the World population from 1995 to 2100 is made up of 2 assumptions. First, the U. S. Census Bureau (1996) has made projections to the year 2050. These assumptions rely on the prediction that the net growth rate of population world-wide will drop from over 1.4%/y now to ~ 0.5%/y in 2050. See Figure 10. The next assumption is that the world wide population growth rate (net of the births minus deaths) will fall linearly to zero from 2050 to 2100.
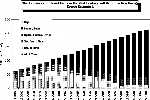 Figure 10
The result of these simple assumptions is that the World population will asymptote out at ~ 10.6 billion people in 2100 (see Figure 11)
 Figure 11
The next assumption has to do with the annual energy use per capita. Here we can use the prediction that the annual Worldwide energy use per capita will rise from ~ 11 boe in 1995 to 15 boe in the year 2050 (see Figure 12). It is further assumed that the drive to improve the standard of living in under developed nations will continue to push up the overall energy use rate per capita from 15 boe in 2050 to 20 boe in 2100. Remember that the latter number is still 1/3 that of the present U. S. per capita use rate.
 Figure 12
Multiplying the population and the energy use values at each year reveals that the total World energy consumption will rise from ~ 60 billion boe in 1995 to ~ 210 billion boe in 2100.
 Figure 13
The next step is to see how much total energy will be needed in the 21st Century and do we have enough fossil fuels on hand? The cumulative amount of energy needed to satisfy even the most conservative scenario (see Figure 9) reveals that from 1995 to the year 2050 we will have to use up ~ 6 trillion boe of energy and by the year 2100, that cumulative number will reach over 14 trillion boe. Since the estimate (see Lecture 3) of economically recoverable fossil fuels is ~ 7 trillion boe (1 tboe oil, 1 tboe natural gas, and 5 tboe coal), our simple calculations predict real trouble by the year 2060
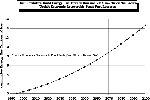 Figure 14
In order to illustrate this point even further, let us consider the 3 possible energy scenarios outlined in Figure 15 ( of course, there could be even others but it is expected that these represent the "extremes")
 Figure 15
The starting point for all three scenarios is the present world energy mix. We will assume that this % mix will prevail for the near future and that reductions in the use rate will occur as each of the fuels exceeds their projected limits.
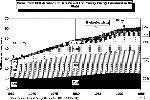 Figure 16
The major assumptions in scenario 1 are given in Figure 17.
 Figure 17
From Figure 18 it is apparent that oil, and natural gas will not last the full 21 Century and in fact may be "effectively" exhausted for the World market by ~2050. Large increases in coal consumption are required after ~ 2020 to satisfy the world wide needs for liquid and gaseous fuels. There is a gap between what is available and what is required that begins to develop by ~ 2060 and if we wish the 5 trillion boe of coal to last thru the end of the 21st Century, then a new energy source is needed in the latter part of the next Century. This new energy source, must produce ~ 75% of the world wide energy in 2100. (Remember, this is in addition to requiring that the hydro, fission, wind, and other sources provide 14% of the World energy during that time period).
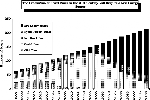 Figure 18
The assumptions for the 2nd scenario are given in Figure 19. The main difference being that a new energy source (fusion, solar, etc.) would be introduced in 2015 (first commercial unit) and that the penetration of that source into the energy market would follow an aggressive, but realistic rate. It is also assumed that the percentage of the energy market that the new energy source would capture is 50% in the year 2050 and that the % would remain constant until the end of the century. This will allow the coal resources to be stretched out to 2100 before they are essentially exhausted.
 Figure 19
The assumed market penetration rate was derived from the historical penetration rates of fission reactors into the electrical generating market. (see Figure 15) The rate used for this analysis is higher than in the U. and lower than experienced in France. The rate used here is only slightly higher than that found in Japan and it would result in a 50% market share by 2050.
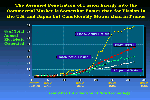 Figure 20
The result of scenario 2 on the mix of world energy sources in the 21st century is shown in Figure 21. Note that there has been no effect on the exhaustion rate of oil and natural gas. The assumed penetration rate (along with the 14% share from Fission, Solar, Wind, etc.) means that there is no gap developed in the 21st Century although one still would have to deal with the 22nd Century if all the fossil fuels are exhausted in the 21st Century.
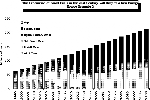 Figure 21
Finally, the assumptions used for the 3rd scenario are given in Figure 22. The most important change here is that the new energy source does not saturate at 50% of the market in 2050 but rather 80% in 2080. This will allow ~ 2 trillion boe of coal to be left at the end of the 21st Century for use in the 22nd Century. See Figure 23.
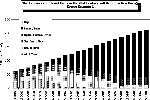 Figure 23 Figure 23 |
 Figure 22 Figure 22 |
The logical conclusions that can be drawn from the 3 energy scenarios are given in Figure 24.
 Figure 24
It is important to note that there is probably nothing a new energy source from space can do to save the liquid and gaseous fossil fuels. The best hope is that these new energy sources could get us through the 21st Century with some solid fossil fuel for the 22nd Century.
Finally, the introduction of a 3He fusion economy can greatly reduce the amount of CO2 emitted after 2030.
 Figure 25
The impact of an advanced fusion economy on CO2 emission can be significant.
 Figure 26
Think about the long range implications of each of these scenarios!
References
United States Census Bureau, 1996, "Total Mid-Year Population for the World, 1950-2050", see URL http://www.census.gov/ftp/pub/ipc/www/worldpop.html
Vondrak, R. R., 1974, "Creation of an Artificial Lunar Atmosphere," Nature, 248, p. 657
Vondrak, R. R., 1988, "Lunar Base Activities and the Lunar Environment,"
Proc. of Lunar Bases and Space Activities, NASA Conf. Pub. 3166, p. 337
Sample Questions
1.) What other terrestrial energy sources could we consider for scenario 3? (make sure that there is enough "fuel" or land to satisfy all the needs throughout the 21st Century.
2.) Calculate the amount of 3He that would have to be mined to satisfy scenario 3 up through the year 2100.
3.) Calculate the number of 5 GWe SPS's needed to supply the needs from scenario 3.
4.) Calculate the number of 5 GWe -Lunar SPS's needed to supply the needs from scenario 3.
 |
|
University of Wisconsin Fusion Technology Institute · 439 Engineering Research Building · 1500 Engineering Drive · Madison WI 53706-1609 · Telephone: (608) 263-2352 · Fax: (608) 263-4499 · Email: fti@engr.wisc.edu |
Copyright © 2003 The Board of
Regents of the University of Wisconsin System.
For feedback or accessibility issues, contact
web@fti.neep.wisc.edu.
|